The goal of d2r is to support the creation, reading, writing, and rendering of D2 diagrams using R.
What is D2? From the D2 Introduction:
D2 is a diagram scripting language that turns text to diagrams. It stands for Declarative Diagramming. Declarative, as in, you describe what you want diagrammed, it generates the image.
I am a contributor to the D2 Extension for Quarto and created this package to experiment with the possibilities of native R diagram creation and rendering.
Note that this package is experimental and the process for building and editing D2 diagrams is likely to change. I also hope to add a knitr engine to support d2 code blocks within a RMarkdown or Quarto document.
Installation
You can install the development version of d2r like so:
# pak::pkg_install("elipousson/d2r")Examples
Setup
If d2 is installed and available on your PATH, you can check the version:
d2_version()
#> ℹ v0.7.0 <https://d2lang.com/releases/0.7.0>
If you have D2 installed with Homebrew, you may have trouble rendering a diagram within a RMarkdown. If so, you may need to set an environmental variable that points to the D2 PATH.
Use d2_which() to locate the path for the installed version of D2:
d2_which()
#> [1] "/opt/homebrew/bin/d2"
See this 2018 blog post by Tony Tsai on trouble-shooting PATH variable issues for brew-installed commands.
Basic usage
# Helper function for file paths
fig_path <- \(x) {
  paste0(knitr::opts_chunk$get("fig.path"), x)
}

options(
  d2r.pad = 20,
  d2r.direction = "right"
)
Here is a basic example using d2_diagram() to create a basic diagram with two connected shapes based on a named character vector:
simple_diagram <- d2_diagram(
  c("R" = "D2")
)

simple_diagram
#> [1] "direction: right" ""                 "R -> D2"
d2_include(
  simple_diagram,
  fig_path("simple_diagram.png")
)
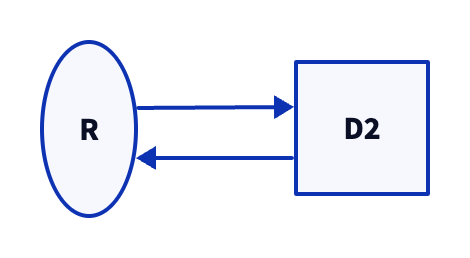
You can pass both named and unnamed lines of text with D2 syntax, specify connectors (used with the named elements), and set the overall direction for the diagram:
connected_diagram <- d2_diagram(
  c("R" = "D2", "D2" = "R"),
  "R.shape: oval",
  "D2.shape: square",
  connector = "->"
)

connected_diagram
#> [1] "direction: right" ""                 "R -> D2"          "D2 -> R"
#> [5] "R.shape: oval"    "D2.shape: square"
d2_include(
  connected_diagram,
  fig_path("connected_diagram.png")
)
The entity-relationship diagrams and table schema can be represented using the SQL table style diagrams with d2_sql_table():
mtcars_tbl <- d2_sql_table(mtcars[, 1:4], id = "mtcars")

mtcars_tbl
#> [1] "mtcars: {\n       label: mtcars\n     shape: sql_table\n        mpg: dbl\n\n    cyl: dbl\n\n    disp: dbl\n\n    hp: dbl\n\n}"

d2_include(mtcars_tbl, output = fig_path("mtcars.png"))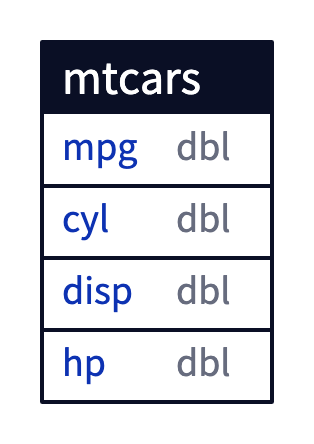
You can use d2_render() to convert a D2 file into a PNG, SVG, PDF, or GIF file. d2_include() is a wrapper for knitr::include_graphics() that helps to include a diagram in a Quarto or R Markdown document:
diagram <- d2_diagram(
  c(
    "Beginning" = "Middle",
    "Middle" = "End",
    "End" = "Beginning"
  ),
  "Beginning.shape: circle",
  "End.shape: square",
  direction = "right"
)

diagram
#> [1] "direction: right"        ""
#> [3] "Beginning -> Middle"     "Middle -> End"
#> [5] "End -> Beginning"        "Beginning.shape: circle"
#> [7] "End.shape: square"

d2_include(
  diagram,
  output = fig_path("include-example.png"),
  sketch = TRUE,
  theme = "Terminal"
)
Related packages and projects
Quarto extension for embedding d2 diagrams in documents:
ggplot2 packages for building diagrams and network visualizations:
Other network visualization packages:
Other packages for working with diagrams:
Find more diagram-focused packages and projects in this GitHub list.