Use patchwork to lay out a list of fixed aspect plots on a larger page
Source:R/page_layout.R
page_layout.RdUse patchwork to lay out a list of fixed aspect plots on a larger page
Usage
page_layout(
  plots = NULL,
  page = NULL,
  width = NULL,
  height = NULL,
  orientation = "landscape",
  byrow = FALSE,
  guides = NULL,
  tag_level = NULL,
  design = NULL,
  paginate = TRUE,
  ncol = NULL,
  nrow = NULL,
  dims = NULL,
  gutter = NULL,
  margin = NULL,
  position = "top-left",
  unit = "in",
  marks = FALSE,
  images = FALSE,
  dpi = 120,
  widths = NULL,
  heights = NULL,
  call = caller_env()
)
Arguments
- plots
Page name, a data.frame with width and height columns, or a list of ggplot2 objects with card plots. Default:
NULL- page
Paper name or a data.frame with width and height columns. Optional if width and height are both provided, Default:
NULL. Ifncolandnroware also supplied,pageis not used to determine the grid size — but ifmarginormarksare used,pagemust still be set to the exact final output size (the same width/height you plan to pass toggplot2::ggsave()), not just the combined size of the grid of plots. Seemarginandmarksfor why this matters.- width, height
Paper width and height, Default:
NULL- orientation
Paper orientation, Optional if width and height are both provided, Default: 'landscape'
- byrow
Analogous to
byrowin matrix(). IfFALSEthe plots will be filled in in column-major order- guides
A string specifying how guides should be treated in the layout.
'collect'will collect guides below to the given nesting level, removing duplicates.'keep'will stop collection at this level and let guides be placed alongside their plot.autowill allow guides to be collected if a upper level tries, but place them alongside the plot if not. If you modify default guide "position" with theme(legend.position=...) while also collecting guides you must apply that change to the overall patchwork (see example).- tag_level
A string (
'keep'or'new') to indicate how auto-tagging should behave. Seeplot_annotation().- design
Specification of the location of areas in the layout. Can either be specified as a text string or by concatenating calls to
area()together. See the examples for further information on use.- paginate
If
TRUE, create a list ofpatchworkobjects when the number of plots is greater than the number of spaces in the plot layout. Default toTRUE.- ncol, nrow
The dimensions of the grid to create. If both are
NULL, dims will be used or dims will be determined based on the plot dimensions.- dims
Optional. Plot dimensions. Ignored if ncol and nrow are supplied. Otherwise, if
NULL(default), dims are inferred based on the dimensions of the first plot in plots.- gutter
Optional. Spacing to add between plots in the grid, as a single number (used for both row and column spacing), a length-2 numeric vector
c(row, col), or a named vector or list withrowandcolelements. Interpreted inunit. Implemented by adding half ofgutterto the interior-facing sides of each plot's ownplot.margin(so two adjacent plots each contribute half, summing to the full gutter between them) based on its row/column position in thencolxnrowgrid — this replaces each plot's existingplot.margin. Plots on the outer edge of the grid are not padded on their outward-facing side; usemarginfor space around the outside of the whole grid. Default:NULL(no extra spacing).gutterchanges the total size of the combined grid (adding(ncol - 1) * col_gutterand(nrow - 1) * row_gutter), whichmarksaccounts for automatically — the automaticncol/nrowcalculation frompage/dimsalso reserves room for it, so fewer plots may fit per page than withgutter = 0.- margin
Optional. A margin to add around the outside of the combined grid of plots, e.g. so the grid can be centered on a larger sheet of paper when saved with
ggplot2::ggsave(). Passed toget_margin()with unit. The margin pads the composed page rather than the individual plots inplots, and does not affect the number of rows and columns in the grid. Default:NULL, which computes a margin frompositionwhenever plot dimensions are known (supplied viadims, or auto-detected from the first plot) — seeposition. Setmarginexplicitly to override that (or to add a margin when dimensions aren't known, e.g.ncol/nrowsupplied withoutdims).marginitself always renders correctly regardless ofpage, because it is applied as a fixed absolute-unit margin around whatever canvas sizeggplot2::ggsave()is eventually called with.marks, below, is the one that depends onpagebeing set correctly — seemarks.- position
Where to place
plotsonpagewhen they don't fill it completely — e.g. fewerplotsthan the page has room for, or a remainder page whenpaginatesplits a longer list. One of"top-left"(default),"top","top-right","left","center","right","bottom-left","bottom", or"bottom-right". Only takes effect when plot dimensions are known (seemargin) andmarginisn't supplied directly; the grid is first shrunk to just the rows/columns needed for the plots being placed (rather than the full page capacity), then the leftover page space is split into amarginthat pushes that grid toward the requested anchor —"center"splits leftover space evenly on both axes,"top-left"(matching the pre-existing default behavior) assigns it all to the bottom/right, and so on.- unit
Unit used for
gutter, and formarginif margin is a bare numeric vector or list (ignored formarginif it is aunitclass object;gutterdoes not supportunitclass objects). Default:"in".- marks
If
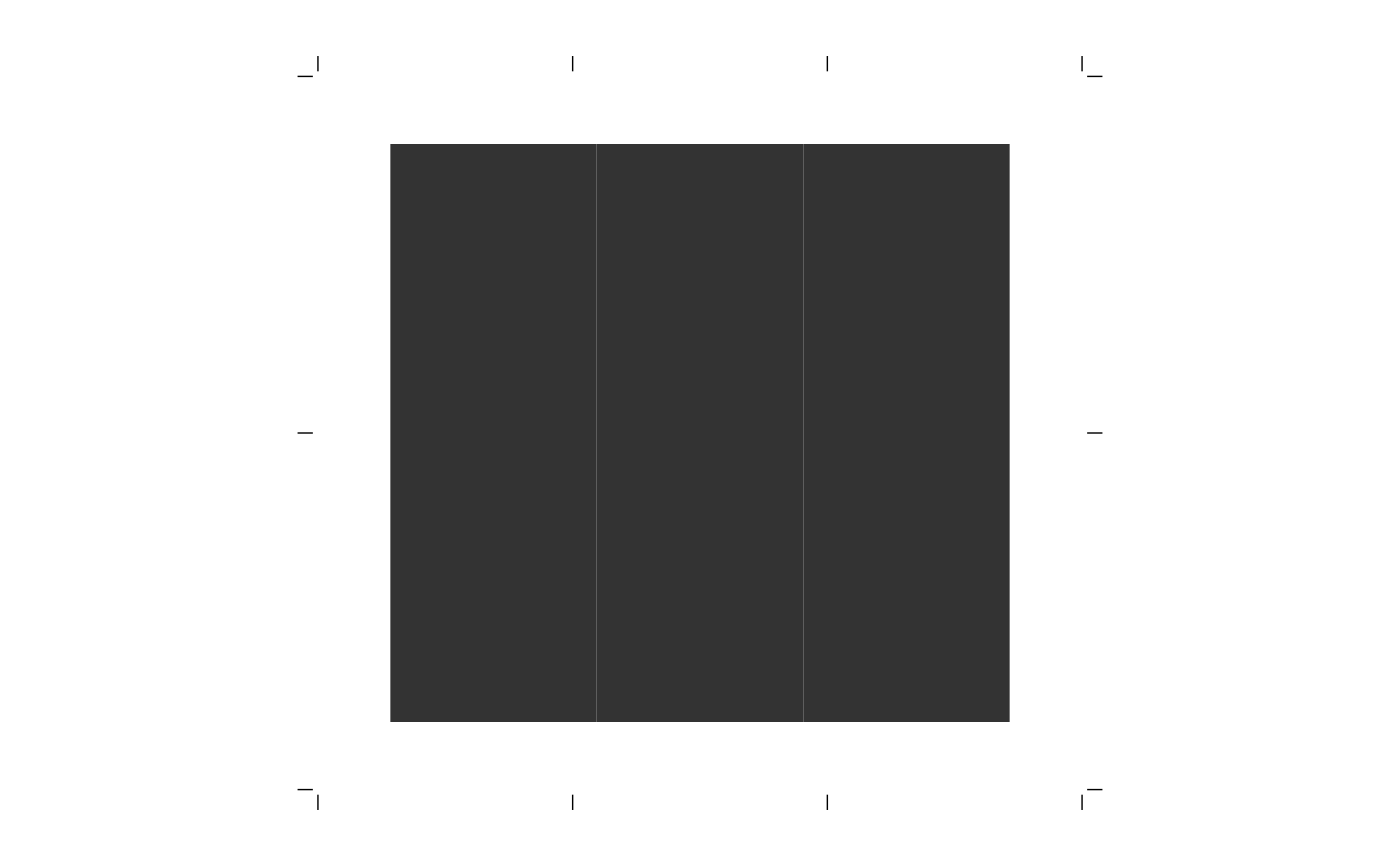
TRUE, add crop marks in themarginarea showing where to cut the page into individual plots. Requiresmargin. Marks are placed assuming the grid of plots exactly fills the page after subtractingmargin, i.e. the same assumptionmarginitself relies on. Default:FALSE.Unlike
margin,marksreadspage(viaget_page_dims()) to work out where the margin area is, sopagemust equal the exact final output size — the same width/height you pass toggsave()— even ifncol/nroware supplied directly andpagewould otherwise be unused. Passing just the combined size of the grid of plots (i.e.pagewithoutmarginadded on) will place the marks in the wrong location, becauseggplot2::ggsave()will render a larger canvas thanmarkswas calculated for.- images
Not yet implemented. If
TRUEand dims isNULL, the input plots are assumed to be plots created withmagick::image_ggplot()and dpi is used to infer dimensions.- dpi
Not yet implemented. Resolution.
- widths, heights
Optional. Column widths and row heights passed to
patchwork::wrap_plots(). By default (NULL), and whenever plot dimensions are known (supplied viadims, or auto-detected from the first plot), each column/row is pinned to that exact size — so plots keep their true physical size instead ofpatchwork's own proportional division of space, which only happens to line up with each plot's true size whenplotsexactly fills every cell of the grid with same-sized content. Passwidths/heightsexplicitly (asunitobjects, one per column/row) to override this.- call
The execution environment of a currently running function, e.g.
caller_env(). The function will be mentioned in error messages as the source of the error. See thecallargument ofabort()for more information.
Examples
page_layout(
plots = plot_cards("Poker", 6),
page = "letter"
)
#> ℹ Using `dims` from first plot in `plots`.
#> $`1`
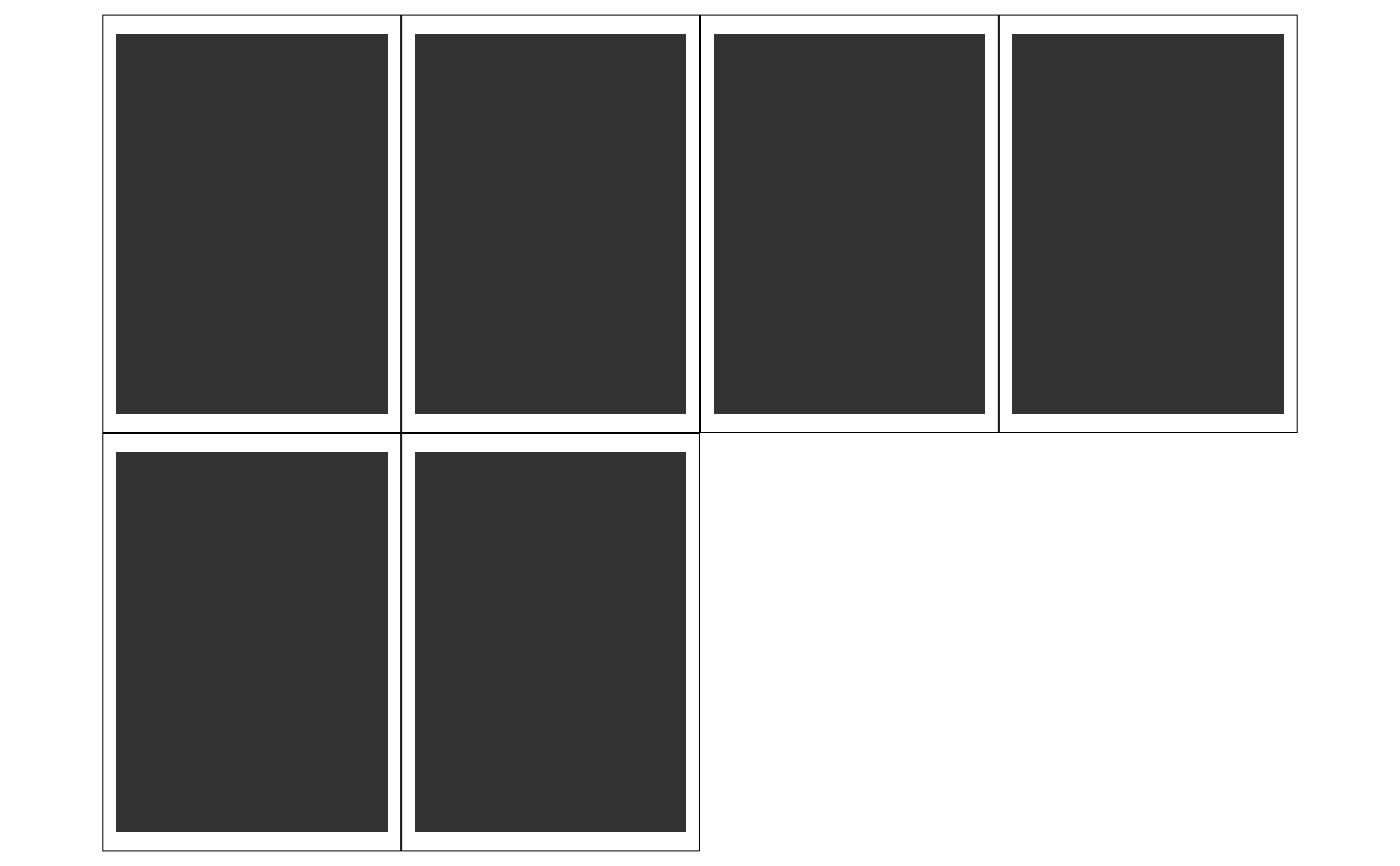 #>
# `page` must be the final output size (grid of 3x2 Poker cards, 7.5x7in,
# plus the 0.5/0.75in margin on each side = 8.5x8.5in), not just the size
# of the grid of plots — this is what ggsave(width, height) should match
page_layout(
plots = plot_cards("Poker", 6),
page = make_page_size(width = 8.5, height = 8.5, units = "in"),
ncol = 3,
nrow = 2,
margin = margins(t = 0.75, r = 0.5, b = 0.75, l = 0.5, unit = "in"),
marks = TRUE
)
#> Warning: `orientation` can't be set to "landscape" when the page width is 8.5 and height
#> is 8.5.
#> ℹ Orientation kept as "square".
#> $`1`
#>
# `page` must be the final output size (grid of 3x2 Poker cards, 7.5x7in,
# plus the 0.5/0.75in margin on each side = 8.5x8.5in), not just the size
# of the grid of plots — this is what ggsave(width, height) should match
page_layout(
plots = plot_cards("Poker", 6),
page = make_page_size(width = 8.5, height = 8.5, units = "in"),
ncol = 3,
nrow = 2,
margin = margins(t = 0.75, r = 0.5, b = 0.75, l = 0.5, unit = "in"),
marks = TRUE
)
#> Warning: `orientation` can't be set to "landscape" when the page width is 8.5 and height
#> is 8.5.
#> ℹ Orientation kept as "square".
#> $`1`
 #>
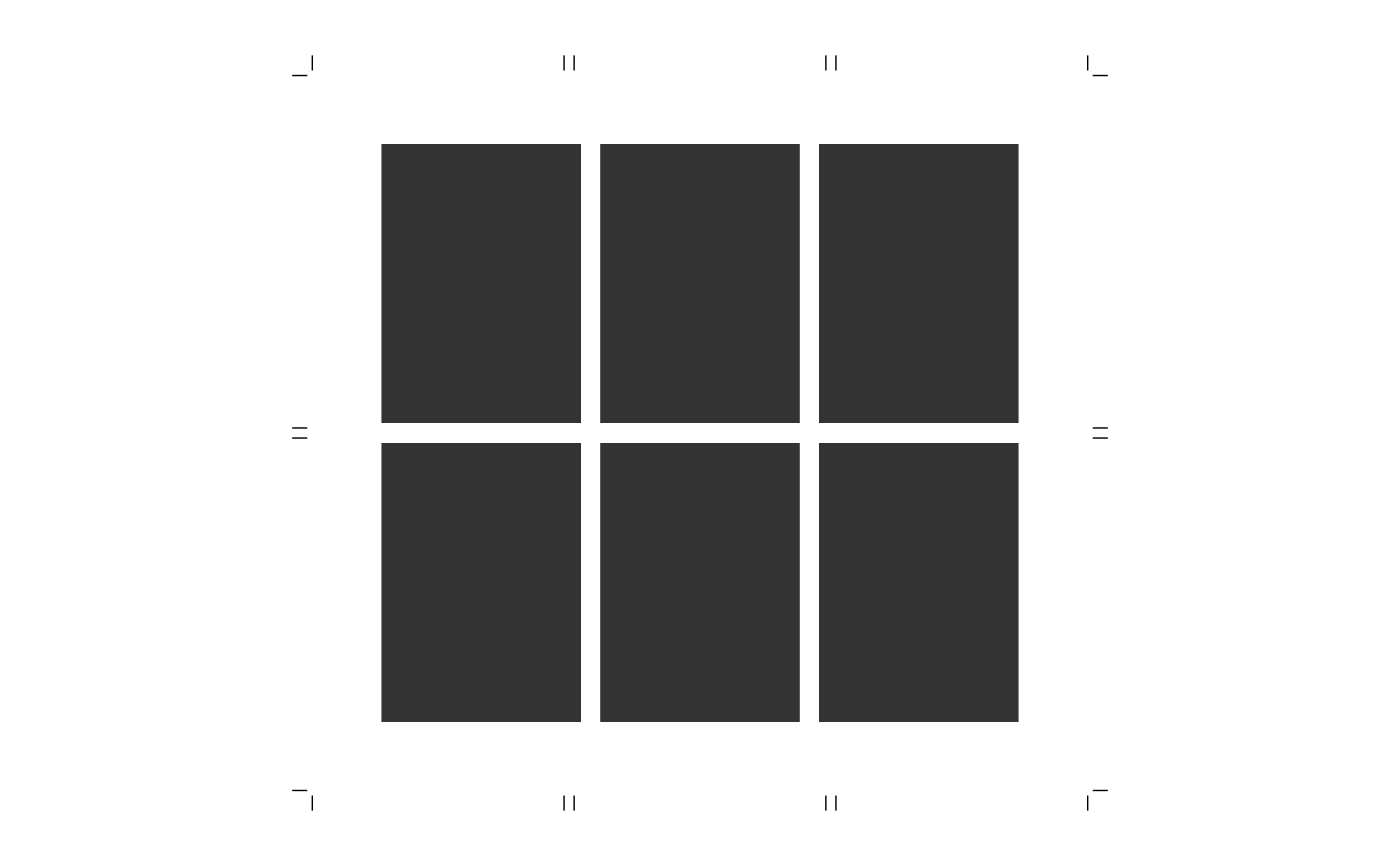
# `gutter` adds spacing between plots, which grows the grid (3x2 Poker
# cards with a 0.1in gutter = 7.7x7.1in) — `page` (and `marks`) account
# for it automatically, so it still needs the full 8.7x8.6in page size
page_layout(
plots = plot_cards("Poker", 6),
page = make_page_size(width = 8.7, height = 8.6, units = "in"),
ncol = 3,
nrow = 2,
gutter = 0.1,
margin = margins(t = 0.75, r = 0.5, b = 0.75, l = 0.5, unit = "in"),
marks = TRUE
)
#> Warning: `orientation` can't be set to "landscape" when the page width is 8.7 and height
#> is 8.6.
#> ℹ Orientation kept as "square".
#> $`1`
#>
# `gutter` adds spacing between plots, which grows the grid (3x2 Poker
# cards with a 0.1in gutter = 7.7x7.1in) — `page` (and `marks`) account
# for it automatically, so it still needs the full 8.7x8.6in page size
page_layout(
plots = plot_cards("Poker", 6),
page = make_page_size(width = 8.7, height = 8.6, units = "in"),
ncol = 3,
nrow = 2,
gutter = 0.1,
margin = margins(t = 0.75, r = 0.5, b = 0.75, l = 0.5, unit = "in"),
marks = TRUE
)
#> Warning: `orientation` can't be set to "landscape" when the page width is 8.7 and height
#> is 8.6.
#> ℹ Orientation kept as "square".
#> $`1`
 #>
# Fewer plots than the page holds a `position` (default "top-left") to
# decide where the shrunk-to-fit grid lands on the page
page_layout(
plots = plot_cards("Poker", 1),
page = "letter",
position = "center"
)
#> ℹ Using `dims` from first plot in `plots`.
#> $`1`
#>
# Fewer plots than the page holds a `position` (default "top-left") to
# decide where the shrunk-to-fit grid lands on the page
page_layout(
plots = plot_cards("Poker", 1),
page = "letter",
position = "center"
)
#> ℹ Using `dims` from first plot in `plots`.
#> $`1`
 #>
#>