Boundaries and marked locations on maps
boundary_location_maps.RmdGetting started
# library(birdseyeview)
library(mapbaltimore)
library(ggplot2)
library(overedge)
library(birdseyeview)
Set parameters
params <- list(
  data = list(
    type = "neighborhoods",
    package = "mapbaltimore"
  ),
  map = list(
    bbox_dist = 300,
    mapbox_crs = 3857,
    context = "baltimore_city"
  ),
  names = list(
    area = c("Cheswolde", "Cross Country", "Fallstaff", "Glen", "Mount Washington"),
    near = c("Pimlico Good Neighbors", "Arlington", "Central Park Heights"),
    extra = c("Pikesville", "Owings Mills")
  ),
  labels = list(
    area = "Neighborhood coalition",
    near = "CHAI project area",
    other = "SNAP Planning Area"
  ),
  page = list(
    name = "letter",
    orientation = "landscape",
    margin = "none"
  )
)
Get locations
area <-
  get_location(
    type = params$data$type,
    package = params$data$package,
    name = params$names$area
  )

near_area <-
  get_location(
    type = params$data$type,
    package = params$data$package,
    name = params$names$near
  )

area_ext <-
  get_location(
    type = params$data$type,
    package = params$data$package,
    name = c(params$names$area, params$names$near),
    union = TRUE,
    label = params$labels$other
  )

context <-
  suppressWarnings(
    get_location(
      type = params$map$context,
      package = params$data$package,
      location = NULL
    )
  )

params$bbox <-
  st_bbox_ext(
    x = area_ext,
    dist = params$map$bbox_dist
  )

params$map$bbox_orientation <-
  sf_bbox_asp(
    bbox = params$bbox,
    orientation = TRUE
  )
Paper set up
params$paper <-
  get_paper(
    paper = params$page$name,
    orientation = params$map$bbox_orientation
  )

params$margin <-
  get_margin(
    margin = params$page$margin,
    paper = params$paper$name,
    orientation = params$paper$orientation
  )

params$map$block_asp <-
  get_asp(
    paper = params$paper$name,
    orientation = params$paper$orientation,
    margin = params$page$margin,
    block_asp = TRUE
  )


params$bbox_paper <-
  st_bbox_ext(
    x = params$bbox,
    asp = params$map$block_asp
  )
Make a basemap
Mapbox
layer_snapbox <-
  function(bbox,
           map_style = snapbox::mapbox_gallery_moonlight(), # snapbox::mapbox_galley_pencil(),
           scale_ratio = 1,
           access_token = Sys.getenv("MAPBOX_SECRET_TOKEN"),
           basemap = FALSE,
           neatline = TRUE,
           ...) {

    # Set appropriate CRS for Mapbox
    crs_mapbox <- 3857

    if (check_sf(bbox)) {
      bbox <- sf::st_bbox(bbox)
    }

    bbox <- sf_bbox_transform(
      bbox = bbox,
      crs = crs_mapbox
    )

    if (basemap) {
      snapbox_layer <- ggplot2::ggplot()
    } else {
      snapbox_layer <- NULL
    }

    # Get Mapbox map
    snapbox_layer <-
      list(
        snapbox_layer,
        snapbox::layer_mapbox(
          area = bbox,
          map_style = map_style,
          scale_ratio = scale_ratio,
          mapbox_api_access_token = access_token
        )
      )

    if (neatline) {
      snapbox_layer <-
        list(
          snapbox_layer,
          overedge::layer_neatline(
            data = bbox,
            ...
          )
        )
    }

    return(snapbox_layer)
  }

layer_location_mapbox <-
  layer_snapbox(
    bbox = params$bbox,
    scale = 0.7,
    basemap = FALSE,
    neatline = TRUE,
    expand = TRUE
  )

basemap_mapbox <-
  ggplot() +
  layer_location_mapbox
Streets data
layer_msa_streets <-
  # NOTE: This layer could be replicated using overedge along but is isn't essential
  mapbaltimore::layer_area_streets(
    area = sf_bbox_to_sf(params$bbox_paper),
    color = "gray60",
    msa = TRUE,
    size = 0.25
  )
#> Reading layer `baltimore_msa_streets' from data source
#>   `/Users/elipousson/Library/Caches/mapbaltimore/baltimore_msa_streets.gpkg'
#>   using driver `GPKG'
#> Simple feature collection with 792 features and 22 fields (with 7 geometries empty)
#> Geometry type: MULTILINESTRING
#> Dimension:     XY
#> Bounding box:  xmin: 413476.4 ymin: 180341.8 xmax: 433957.6 ymax: 198210.8
#> Projected CRS: NAD83(HARN) / Maryland

layer_location_streets <-
  layer_location_data(
    data = "streets",
    package = params$data$package,
    location = params$bbox_paper
  )
basemap_alternate <-
  ggplot() +
  layer_location_data(
    data = baltimore_msa_counties,
    fill = "lightblue",
    alpha = 0.2
  ) +
  layer_msa_streets
basemap_mapbox +
  layer_location_data(
    data = area_ext,
    fill = "yellow",
    alpha = 0.25,
    crs = params$map$mapbox_crs
  ) +
  layer_show_location(
    data = area,
    size = 1,
    color = "gray20",
    linetype = "solid"
  ) +
  layer_location_data(
    data = area,
    geom = "label",
    mapping = aes(label = name),
    size = 3,
    color = "black"
  )
#> Coordinate system already present. Adding new coordinate system, which will replace the existing one.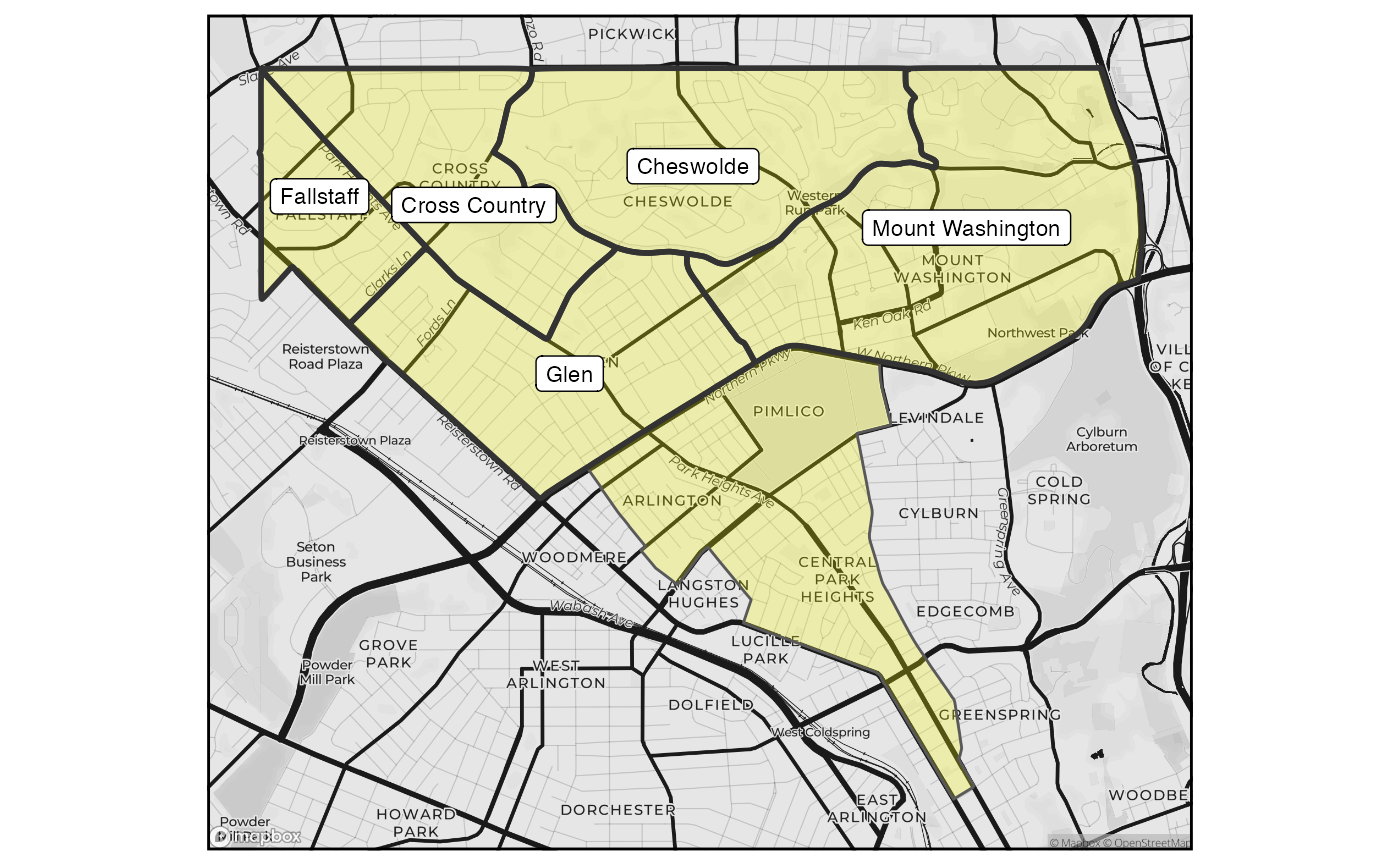
Common map types
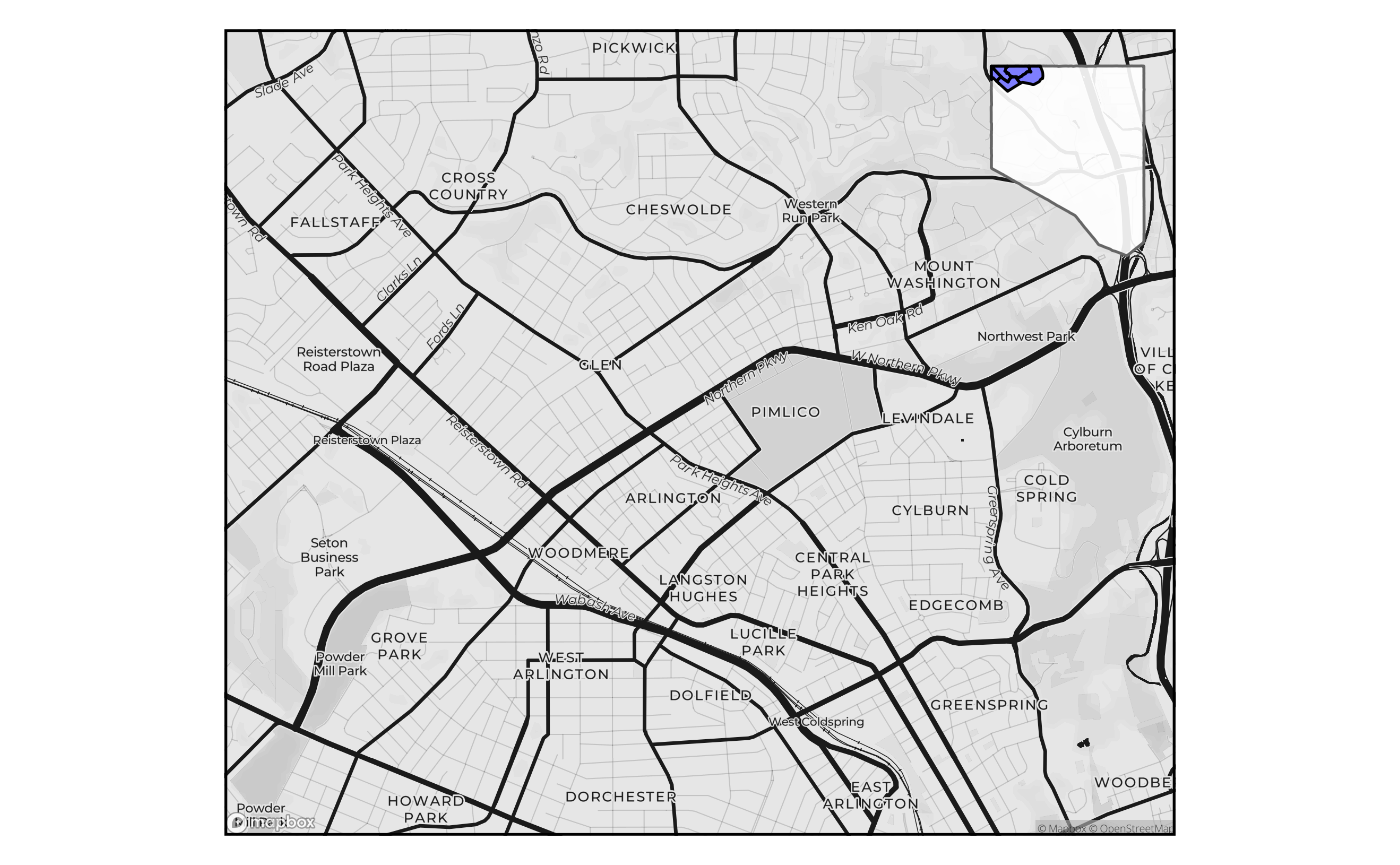
Inset map
inset <-
  ggplot() +
  layer_show_context(
    data = area,
    fill = "blue",
    alpha = 0.5,
    context = context,
    context_aes = list(
      color = "gray40",
      size = 0.1,
      fill = "white",
      alpha = 0.9
    ),
    crs = 3857
  )

make_inset_map(
  map = basemap_mapbox,
  inset = inset,
  position = "topright",
  nudge_y = -0.05
)
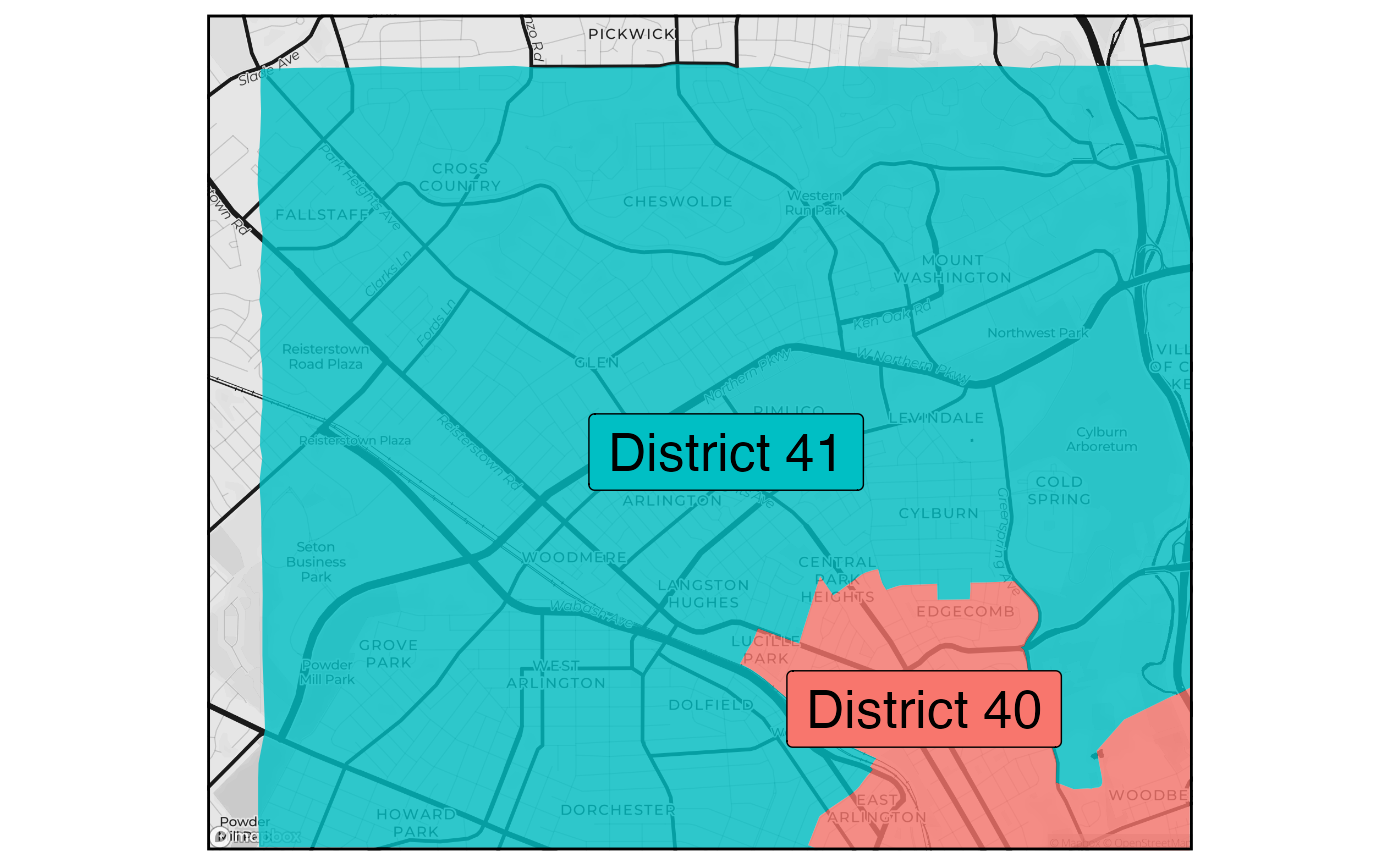
Overlapping boundaries
params$map$admin_boundaries <-
  c("council_districts", "legislative_districts")

# Apply a negative buffer to avoid overlap with state legislative District 40
map_admin_boundaries <- function(type = NULL) {
  admin_boundaries <-
    get_location_data(
      data = type,
      package = params$data$package,
      location = params$bbox,
      crop = TRUE,
      crs = 3857
    )

  basemap_mapbox +
    layer_location_data(
      data = admin_boundaries,
      aes(fill = name),
      color = NA,
      alpha = 0.8
    ) +
    layer_location_data(
      data = admin_boundaries,
      geom = "label",
      location = params$bbox_paper,
      aes(label = name, fill = name),
      color = "black",
      size = 7,
      label.padding = unit(0.5, "lines"),
      hjust = 0.5,
      vjust = 0.5
    ) +
    overedge::theme_legend(
      position = "none"
    )
}

purrr::map(
  params$map$admin_boundaries,
    ~ map_admin_boundaries(.x)
  )
#> Coordinate system already present. Adding new coordinate system, which will replace the existing one.
#> Coordinate system already present. Adding new coordinate system, which will replace the existing one.
#> [[1]]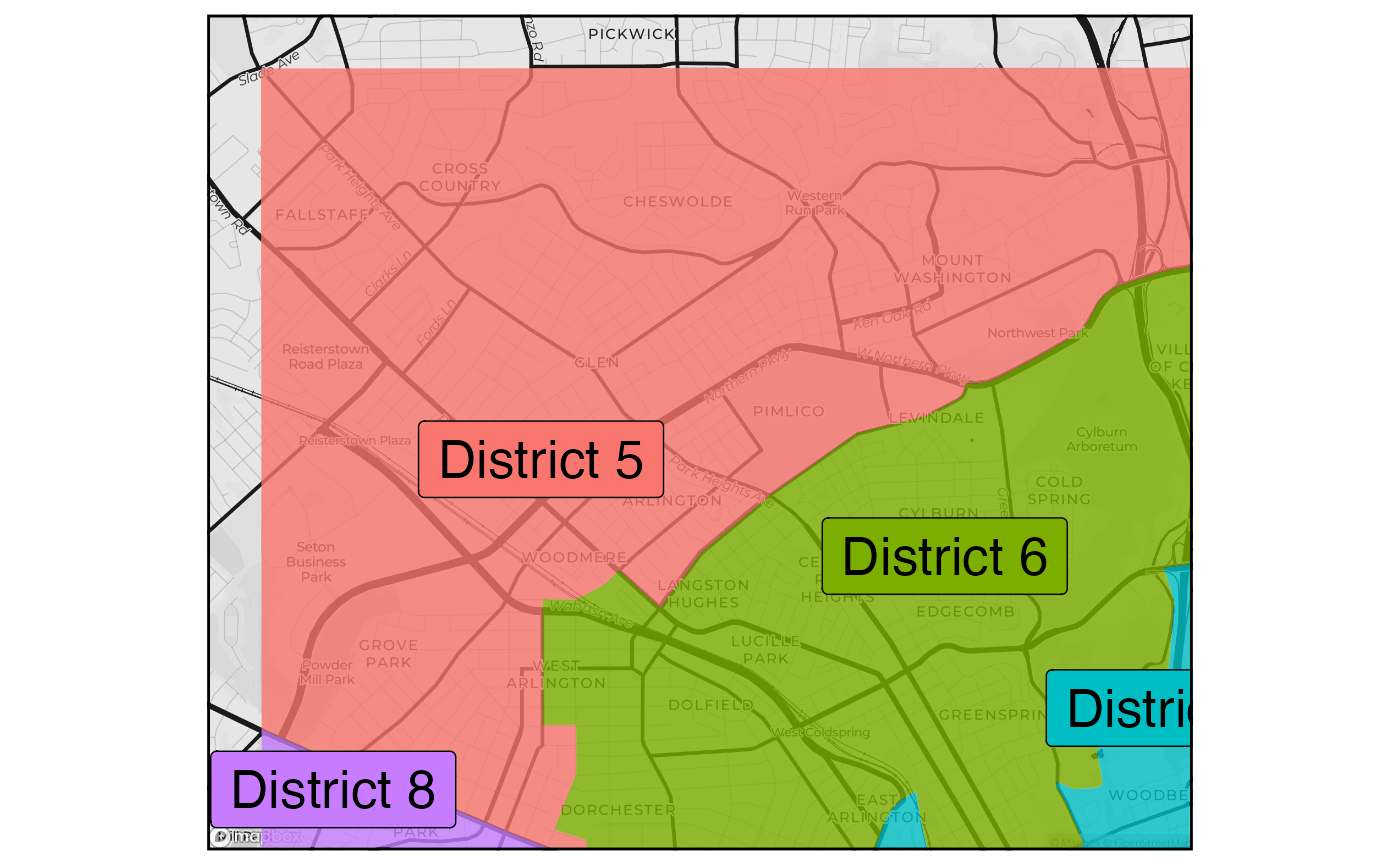
#>
#> [[2]]