Read spatial data and create a map with QGIS
Read vector and tabular spatial data with QGIS then filter data by attribute.
Create a map that uses size, color, fill, or other aesthetics to visualize attributes from the data set.
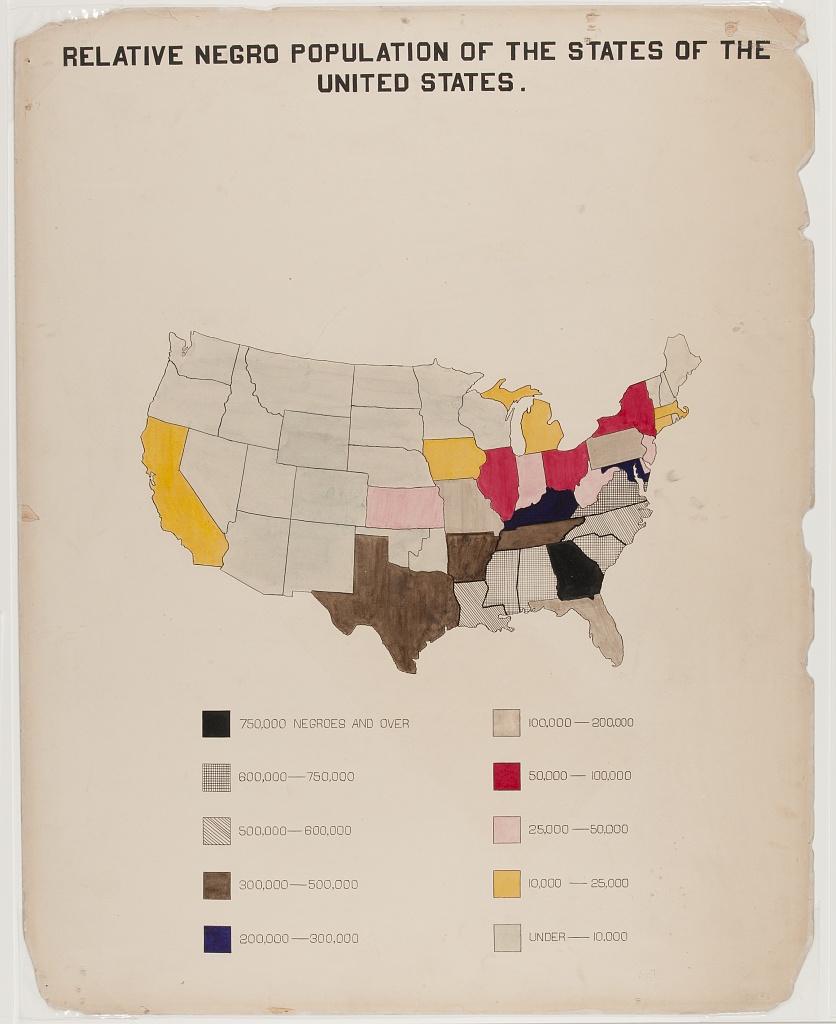
(“[The Georgia Negro] Relative Negro population of the states of the United States.” n.d.)
This assignment has two parts:
Reading spatial data with QGIS
Creating a map with QGIS
This assignment can be completed by following the linked tutorials but you are encouraged to experiment. You are welcome to use the Natural Earth quick start kit alone or in combination with another data set from Maryland iMap or Open Baltimore. You may use this assignment to continue exploring a data sets identified when you completed the first assignment on finding spatial data.
Read spatial data with QGIS
The key steps for this assignment include:
Read a vector dataset into QGIS.
Use the Attributes toolbar and Select By Expression window to filter the data based on one or more attributes.