The goal of maplayer is to provide a consistent set of functions for creating map layers using simple feature ({sf}) data, the {ggplot2} package, and a variety of ggplot2 extension packages.
Basic functions
The main layers that work with both a data and location sf object are:
There are several layers that can work with a single sf object as the input data:
Finally, there are layers that require additional packages (listed in Suggests):
-
layer_labelled()optionally uses {ggrepel} or {geomtextpath} -
layer_mapbox()uses {mapboxapi} (requires an API key) -
layer_marked()uses {ggforce} -
layer_icon()uses {ggsvg} -
layer_inset()uses {patchwork} or optionally {figpatch} (forstamp_inset_img())
The package also allows the optional use of packages designed for transforming spatial data or modifying ggplot2 maps. These include:
- {smoothr} (required to use the smooth_params argument)
- {ggfx} (required to use the shadow_params argument)
Many of the functions in {maplayer} were originally developed for the {overedge} package or before that for the {mapbaltimore} package. The {overedge} package has been split up into three smaller packages including {maplayer}, {getdata}, and {sfext}.
Installation
You can install the development version of maplayer like so:
pak::pkg_install("elipousson/maplayer")Example
library(maplayer)
library(ggplot2)
library(sf)
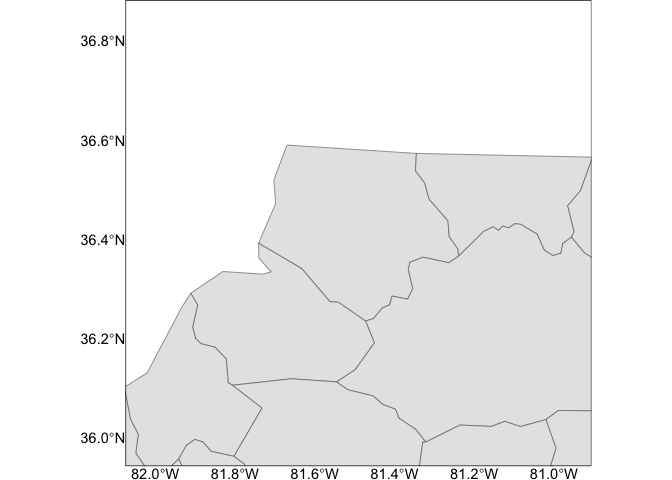
#> Linking to GEOS 3.11.0, GDAL 3.5.3, PROJ 9.1.0; sf_use_s2() is TRUEAdd icons to a map
layer_icon() wraps ggsvg::geom_point_svg() to provide an convenient way to make icon maps.
You can create maps using a single named icon that matches one of the icons in map_icons.
nc <- read_sf(system.file("shape/nc.shp", package = "sf"))
nc <- st_transform(nc, 3857)
theme_set(theme_void())

nc_map <-
  ggplot() +
  geom_sf(data = nc)

nc_map +
  layer_icon(data = nc, icon = "point-start", size = 8)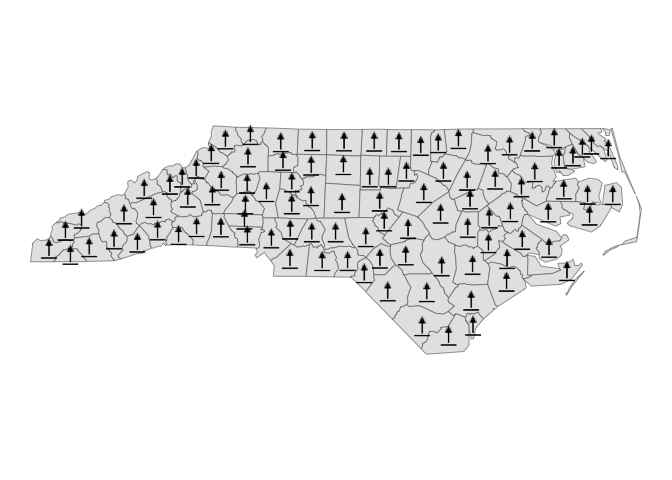
Add a neatline to a map
layer_neatline() hides major grid lines and axis label by default. The function is useful to draw a neatline around a map at a set aspect ratio.
nc_map +
  layer_neatline(
    data = nc,
    asp = "6:4",
    color = "gray60", linewidth = 2, linetype = "dashed"
  )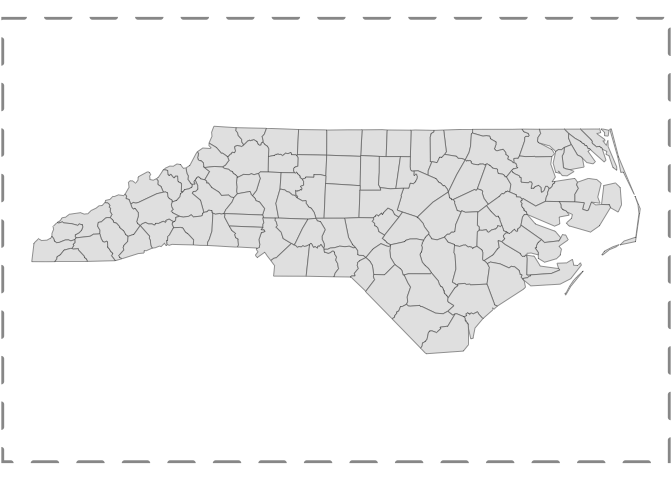
layer_neatline() can also be used to focus on a specific area of a map with the option to apply a buffer as a distance or ratio of the diagonal distance for the input data. The label_axes and hide_grid parameters will not override a set ggplot theme.
nc_map +
  layer_neatline(
    data = nc[1, ],
    diag_ratio = 0.5,
    asp = 1,
    color = "black",
    label_axes = "--EN",
    hide_grid = FALSE,
    expand = FALSE
  )
Add labels or numbers to a map
nc_map +
  layer_labelled(
    data = nc[c(10, 20, 30, 40), ],
    geom = "sf_label",
    mapping = aes(label = NAME)
  )
nc_map +
  layer_numbers(
    data = nc[c(10, 20, 30, 40), ],
    aes(fill = NAME),
    num_style = "Alph",
    size = 3.5
  ) +
  guides(fill = "none")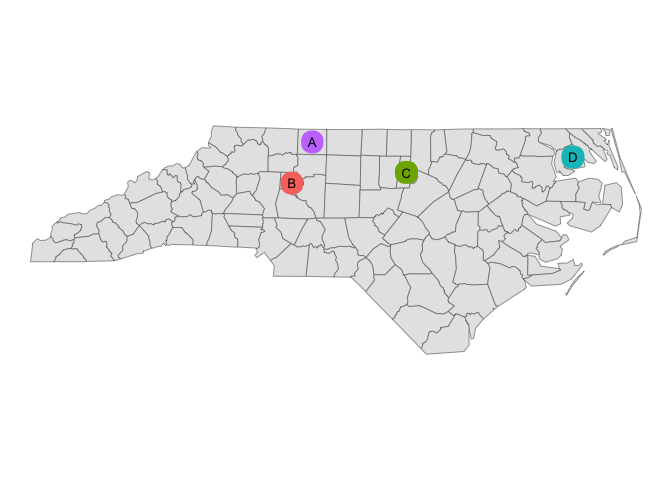
Create a frame around a feature
circle_nc <-
  ggplot(data = nc) +
  # layer_frame requires a data arg if neatline = TRUE
  layer_frame(data = nc, style = "circle") +
  # layer_location_data can inherit data
  layer_location_data()

circle_nc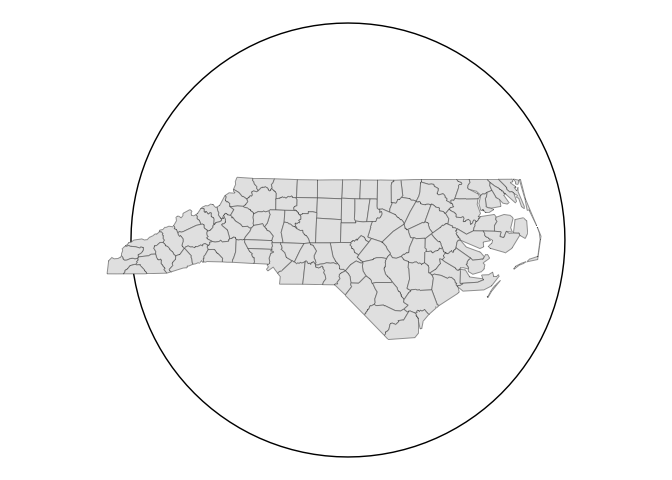
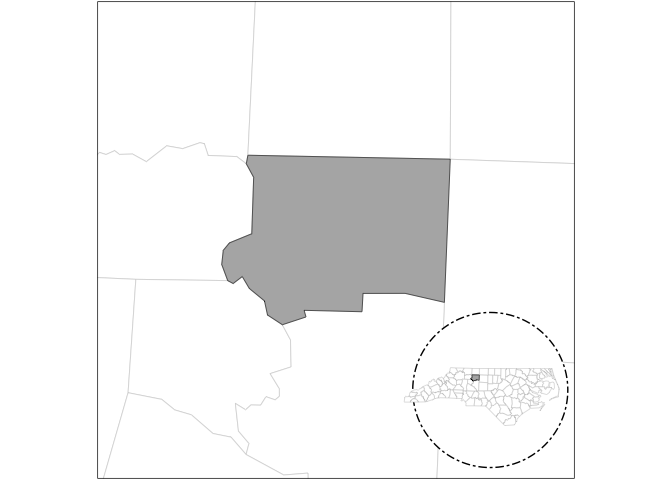
Create an inset map
nc_context <-
  layer_frame(
    data = nc,
    linetype = "twodash",
    neatline = FALSE,
    basemap = TRUE
  ) +
  layer_location_context(
    location = nc[25, ],
    context = nc,
    context_params = list(fill = "white", color = "gray80", alpha = 1),
    neatline = FALSE
  )

nc_context +
  layer_neatline(
    data = nc[25, ],
    dist = 15,
    unit = "mi",
    asp = 1
  ) +
  layer_inset(
    inset = nc_context,
    scale = 1.5
  )