
This post is a slightly revised version of my lunchtime lightning talk at Baltimore Data Day 2017. This script corresponds to my slides. Thanks to Ciara Christian for the opportunity to share my work around vacant housing, trash, and 311 data.
Introduction
Hello! My name is Eli Pousson and I work for Baltimore Heritage, a small nonprofit that advocates for historic preservation across the city. I’ll admit I’m a not a statistician or a GIS expert. I’m a professional historian and an amateur data nerd. I also won’t pretend to have any “objectivity” about vacant houses and trash in Harwood. I live in Harwood and I care about what happens in my neighborhood.
Harwood
Harwood isn’t the kind of neighborhood most people think about when you say the words “historic preservation.” It isn’t a historic district and our homes are mostly modest two-story rowhouses. But I like to think about preservation as the work of keeping old buildings in use and making old neighborhoods better places for the people who live there.
Harwood Park
Because old buildings aren’t the only places that need a little tender loving care. So, for nearly a year, I’ve been hanging out at Harwood Park on the 400 block of E. 27th Street cleaning up a few times a month. If a clean park helps to create a more stable housing market, even in a small way, that helps old buildings in my neighborhood.
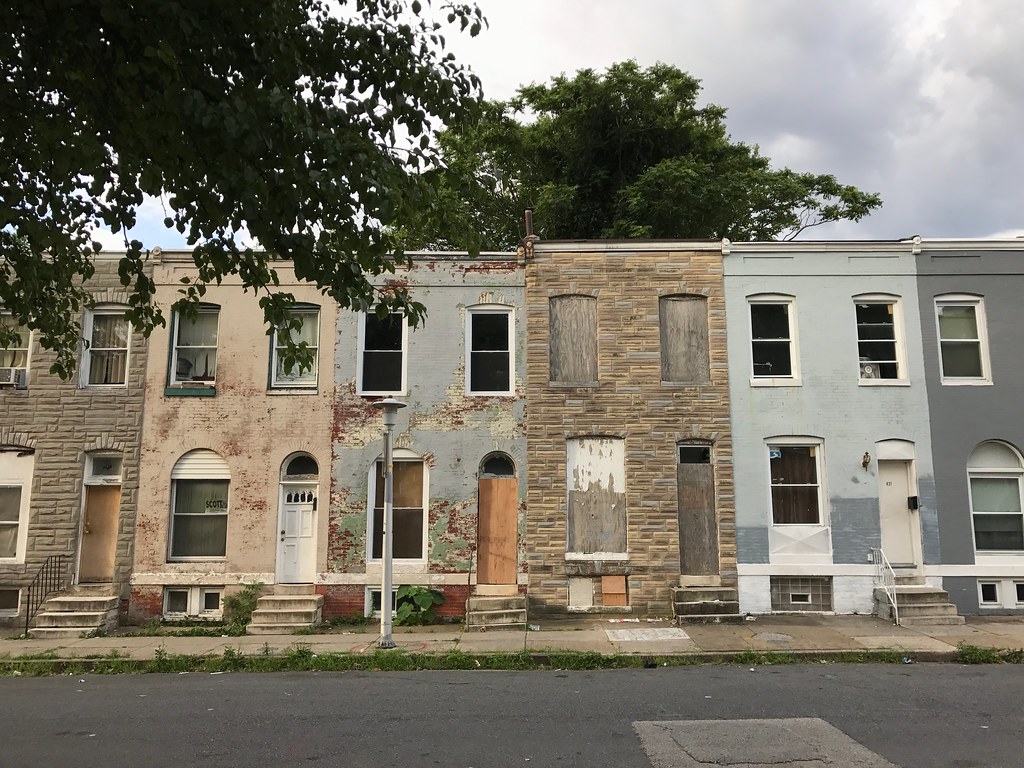
Vacants on E. 27th Street
And old buildings in my neighborhood need help. These vacant houses stand right across the street from the park. Overall, the Greater Charles Village/Barlcay Community Statistical Area has a 5.4% vacancy rate—less than the city average. But, as most Baltimoreans know, you can’t ignore the challenge of unoccupied and neglected buildings that haven’t yet met the city’s requirements to issue an official vacant building notice.
Vacant Buildings 101
This past winter, Baltimore Heritage partnered with the Community Law Center to develop a workshop we called Vacant Buildings 101 to teach community residents how to deal with vacant buildings. And the workshop gave me an opportunity to wonder: How can data help people deal with vacant buildings?
Data can help me to look at a vacant house and see more than just an “eyesore.” I can look and see if code enforcement is working for my neighborhood. I can use 311 data to build a case for a vacant building notice. I can learn when fighting for building rehabilitation and reuse makes sense and when stabilization or demolition may be the only option.
411 E. 27th Street
Of course, most folks don’t deal with vacant houses as data in a spreadsheet. They deal with vacants one at a time.
411 E. 27th Street is a single data point: a vacant building notice issued on February 19, 2015. One of thirty-five vacant building notices in Harwood. One of five on this block.
Trash by the entrance to Harwood Park
Vacant houses are not the only problem on this block. I may not have the money to fix up every old house in Harwood but I can do something about this mess on our our playground. And I can tell you that picking up garbage and using 311 to report illegal dumping is a great way to learn about using and making open data in your neighborhood.
1965 report from the Citizens Planning & Housing Association
The challenge of gathering data and interpreting data on vacants has a long history. In a 1965 report, the Citizens Planning & Housing Association wrote:
“No one person knows how many vacant houses are owned by the city, how many should be razed, how many have a known owner, how many are needed for other uses and how many are involved in some stage of the law enforcement process.”
Where does data come from?
While we have a lot more of this data today, I can say with confidence that many of my neighbors don’t know where to find or how to interpret data on vacants in our neighborhood.
In addition, vacant building notices are tied to code enforcement actions. These actions are often triggered by 311 reports and we can expect people from different background to use 311 in different ways. This variation reveals the inherently uneven approach we use to identify and document issues in our neighborhoods.
codeMap showing parcels with vacant building notices
So let’s take a look at the data available to me and other residents interested in vacants and trash. codeMap is a remarkable resource for giving residents, community advocates, and developers the opportunity to access much of the same data used by city planners and Housing Department to direct code enforcment officers, prioritize recievership cases, and budget funding for demolition and stabilization.
RS Link database on receivership cases
codeMap also links out to a variety of data sources such as the RSLink database used by Baltimore Housing and One House at a Time to track receivership cases from the first filing to the final sale. I don’t think I’d call this “open” data, however. While you can see these records one at a time, everyday users are not able to search the database or create reports.
CARTO map of receivership auction results
The city doesn’t provide bulk access to this data so I decided reached out to One House at a Time directly. They shared their data on recievership auctions for 2015 and 2016 making it possible for us to create this map showing successful and unsucessful auctions across the city. Five houses in Harwood went through receivership in 2015 and 2016 and all five sold.
“Truck tire” next to 411 E. 27th Street
Back to E. 27th Street. One of the key lessons here is that just because you have access to information doesn’t mean you see it. Sometimes 311 requests get ignored when an inspector can’t find the problem. With a bright pink arrow pointing to the truck tire, I figured they couldn’t miss it. (I’ve used this same approach with several requests, e.g. a mattress on E. 27th Street. The graphic is made with an app called Skitch.)
311 data for Harwood on Open Baltimore
My 311 service requests are important to me but I know they are just a handful of the never-ending stream of service requests that city agencies recieve throughout the year. For example, in 2016, Harwood alone saw 1,720 requests to the Bureau of Solid Waste.
Charting 311 data in Google Sheets
I pulled the 311 data for Harwood from the Open Baltimore data portal into Google Sheets where I could more easily do some basic analysis and share the results with my neighbors. One of the things I learned from this data is that my love for the 311 iPhone app makes me a bit of an outlier. Only a relatively small portion of 311 requests are submitted through the mobile apps. Most of the 311 requests in my neighborhood are submitted by phone.
What happens after you call 311?
I also really wanted to know what happened to my 311 requests and how they compared to those of my neighbors. This complicated flow diagram (made using RAWGraphs and Vectr) was my first attempt at following requests from submission to outcome – I’d love to see what other people can make of this data.
Heatmap of Bureau of Solid Waste service requests in Harwood
I knew we were having problems with dumping at Harwood Park but what about other parts of my neighborhood? I pulled my data from Google Sheets into CARTO, a free web-based GIS mapping tool, to make a heat map for hotspots of illegal dumping. I also solicited feedback from my neighbors on NextDoor. I used the map and feedback from my neighbors to put together a short tour for Terrance Brown from the city’s Department of Public Works.
Hauling concrete debris by hand after repeated 311 requests
My tour with DPW came after I had I’d submitted two 311 service requests for a pile of illegally dumped concrete debris on our playground. Both 311 requests were closed after DPW (or their contractors) removed some trash from the area but left the concrete. I emailed DPW for more information and scheduled the tour to discuss the issue. If we just looked at the data, it looks like we were getting good service in Harwood—but we weren’t yet. I decided to try to deal with the problem myself by piling the concerete into my old half-broken-down wheelbarrow and (with a little help from Donald at the Charles Village Community Benefits District) getting into a dumpster for the Mayor’s Spring Clean Up Day. Four large pieces remained up until late May!
Connecting housing and litter at Whitridge and Greenmount Avenue
Now I’m working around the corner on the lot at Whitridge and Greenmount Avenue. Strong City Baltimore has identified the poor condition as a barrier to the sale of the rehabbed houses on Whitridge Row. It is also unfortunate for people waiting for the bus on Greenount Avenue. While we can use data to argue for the importance of lot improvements, we can also put on some gloves and make a “data visualization” like this one: showing the amount of garbage one person can pick up on this lot in about fifteen minutes.
Making data open
I’ll wrap up by inviting everyone to try to explore how you can make data more open.
- Try setting up an account on Open Baltimore and creating a filtered view for your neighborhood. (See my tutorial on using Open Baltimore for tips.)
- Next time you make a report: skip the PDF and just share a Google Spreadsheet. (I’ve set up Google Sheets with data on demolition permits and citations for property owners who failed to abate unsafe properties.)
- Don’t just record data, take photos and show your work along the way. (I stay motivated to address litter and dumping issues by sharing photos of litter on Instagram at #riseandpickuplitter)
- Don’t just use data. Be part of making data!
Reuse
Citation
@online{pousson2017,
  author = {Pousson, Eli},
  title = {Baltimore {Data} {Day:} {Vacant} Housing, Trash, and Making
    Data Open in {Harwood}},
  date = {2017-07-14},
  url = {https://elipousson.github.io/posts/2017-07-14-baltimore-data-day},
  langid = {en}
}