Add a SVG icons to a ggplot2 plot based on a simple feature object
Source:R/layer_icon.R
layer_icon.RdUse the ggsvg::geom_point_svg() function to plot icons using the centroids
from the input simple feature object to set the icon location.
Usage
layer_icon(
  data = NULL,
  iconname_col = "icon",
  icon = NULL,
  px = NULL,
  source = NULL,
  svg = NULL,
  color = "black",
  crs = NULL,
  ...
)

geom_sf_icon(
  data = NULL,
  iconname_col = "icon",
  icon = NULL,
  px = NULL,
  source = NULL,
  svg = NULL,
  color = "black",
  crs = NULL,
  ...
)
Arguments
- data
A
sfobject. Any objects with polygon geometry are converted to points usingsf::st_centroid().- iconname_col
The column name in the input data to use as the icon name. If the name matches multiple icons, the first match from
map_iconsis used. You may provide a px or source value to select a different match if needed but, in that case, all icons must use the same px or source value. Note that the icon column should not be mapped withggplot2::aes().- icon
Icon name. Default
NULL. Ificonis provided,iconname_colis not used.- px
Icon size in pixels. See
map_icons$pxfor supported options. Optional but may be necessary to differentiate icons with duplicate names.- source
Icon source. See
map_icons$repofor supported options. Optional but may be required to differentiate icons with duplicate names.- svg
Optional. Custom file path or URL with SVG to pass to
svgparameter forggsvg::geom_point_svg(). Ificonis provided,svgis not used.- color
SVG color passed to
ggsvg::geom_point_svg(). default color is set to "black".- crs
Coordinate reference system; defaults to
NULL.- ...
Additional parameters to
ggsvg::geom_point_svg().
See also
ggsvg::geom_point_svg()
map_icons
Other layer:
layer_frame(),
layer_location_data(),
layer_markers(),
layer_mask(),
layer_neatline(),
layer_scaled()
Examples
nc <- read_sf_path(system.file("shape/nc.shp", package = "sf"))
basemap <-
ggplot2::ggplot() +
ggplot2::theme_void() +
layer_location_data(data = nc)
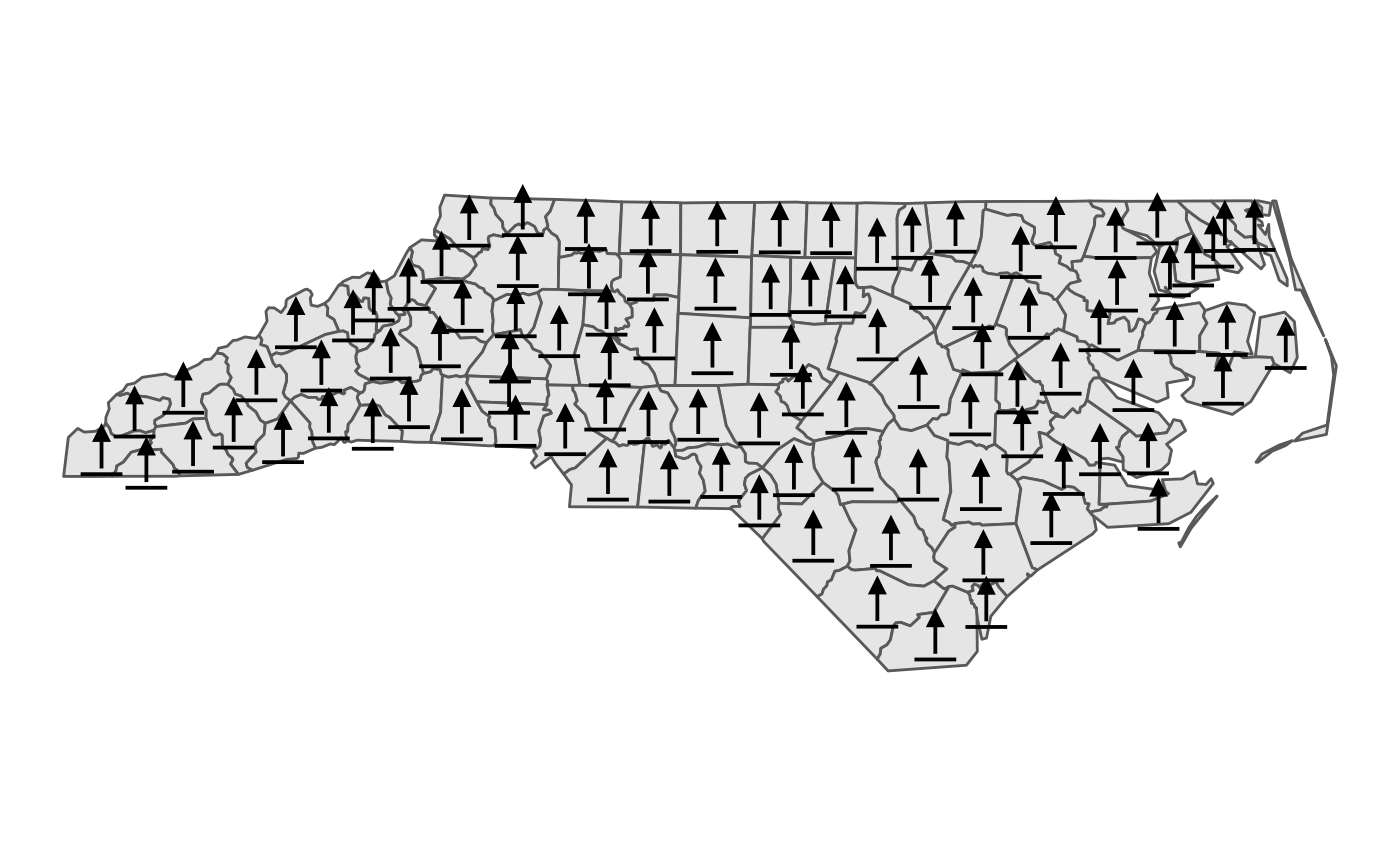
basemap +
geom_sf_icon(data = nc, icon = "point-start", size = 10)
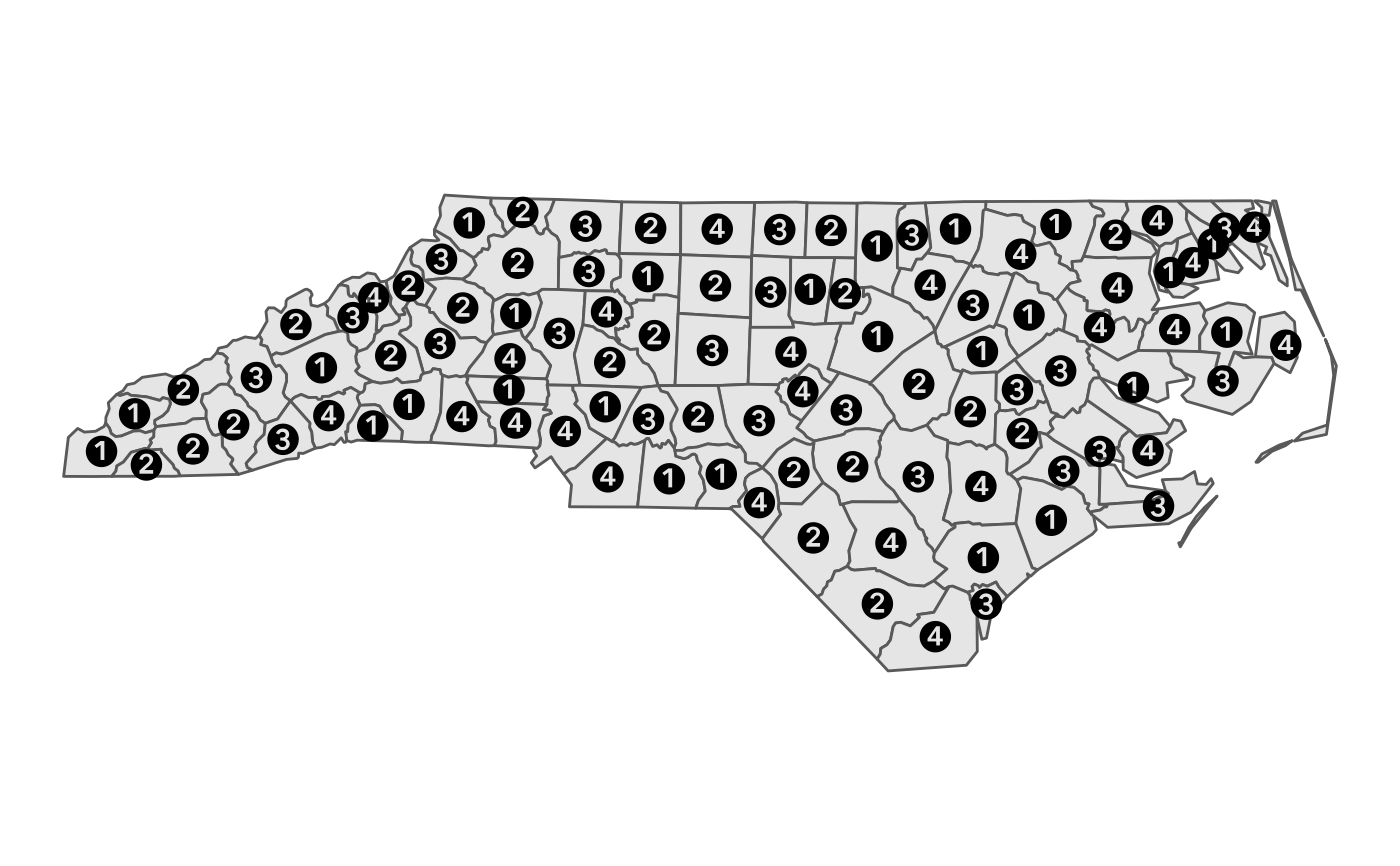
 nc$icon <- rep(c("1", "2", "3", "4"), nrow(nc) / 4)
basemap +
geom_sf_icon(data = nc, size = 5)
nc$icon <- rep(c("1", "2", "3", "4"), nrow(nc) / 4)
basemap +
geom_sf_icon(data = nc, size = 5)